Most of the system administrators find it most difficult in monitoring their system and keep it secured. I must say that, monitoring of systems is a toughest task, should be the primary responsibility of any system administrator. Monitoring of your systems will help you to detect :
* Security risks (failed login attempts, port scan etc) analysis
* Troubleshoot user login problem
* Save disk space
Monitor your system with the help of LogWatch. LogWatch is a customizable, pluggable, log monitoring system for Linux. Logwatch parses through your system’s logs and creates a report and emails as daily digest. I faithfully read Logwatch e-mails every day from each of my servers, and I’m very grateful for the software tool. So here i am writing on how to install and configure LogWatch:
Step 1: How to install LogWatch
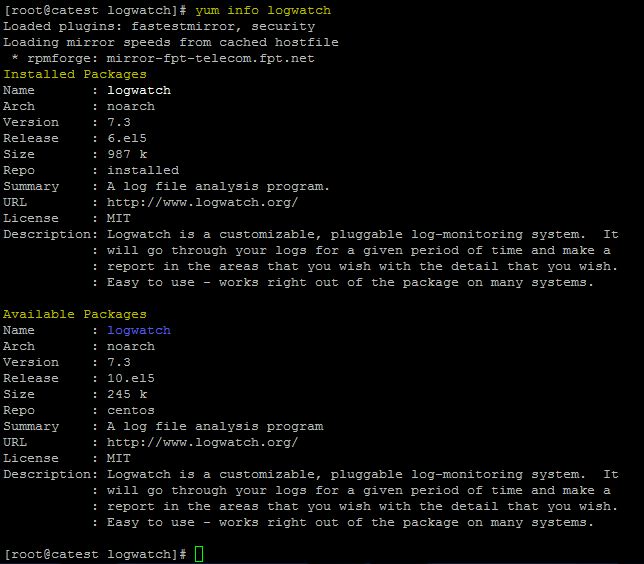
These days by default most of the distros comes with LogWatch installed. Verify the installation using the below command.
#yum info logwatch
If it already finds the installation, then you no need to install, else install using yum.(Know how to configure Yum).
#yum install logwatch
You can also download the LogWatch and install through source installation.
Step 2: Whereis LogWatch installed?
if you had installed through RPM or YUM, usually LogWatch would be installed in the /usr/share/logwatch directory. Our main focus would be on the default.conf directory inside logwatch. This consists of services and logfiles directories which lists the configuration files of services to be monitored.
services directory would consists of configuration files of services to be monitored. For eg: services like sshd, dhcp, httpd, disk usage, network etc., LogWatch monitors and generates reports of all the services listed in the services directory. You can edit those configuration files for each service to fine tune what are the things you are keen to analyze.
Step 3: Configure Home directory, disk usage and mail spool size monitoring in LogWatch
Lets see the configuration file to enable monitoring of “Home directories”, “Disk Usage” and “Mail spool size”. Open the following file in your favorite editor(Vim in my case) and uncomment the lines as shown:
[root@catest services]# vim zz-disk_space.conf
#New disk report options
#Uncomment this to show the home directory sizes
$show_home_dir_sizes = 1
$home_dir = "/home"

#Uncomment this to show the mail spool size
$show_mail_dir_sizes = 1
$mail_dir = "/var/spool/mail"

#Uncomment this to show the system directory sizes /opt /usr/ /var/log
$show_disk_usage = 1
Step 4: Add email Address that logwatch emails the report
[root@catest default.conf]#cd /usr/share/logwatch/defaults.conf/
[root@catest default.conf]# vim logwatch.conf
Locate the below line :
MailTo = root
Change to add your desired email address to which you need the daily digest as shown below:
MailTo = techglimpse.newsletter@gmail.com
You can even add multiple email addresses with a comma(,) seperated as shown below:
MailTo = techglimpse.newsletter@gmail.com, focus4infotech@gmail.com
Follow common practice of sending such monitoring mails from all servers to a mailing list that all admins subscribe to. Once you complete all the configurations, you may run logwatch manually at the command line for testing :
[root@catest default.conf]# logwatch
By default LogWatch runs with daily cron jobs in /etc/cron.daily as shown below (Notice the highlighted) :
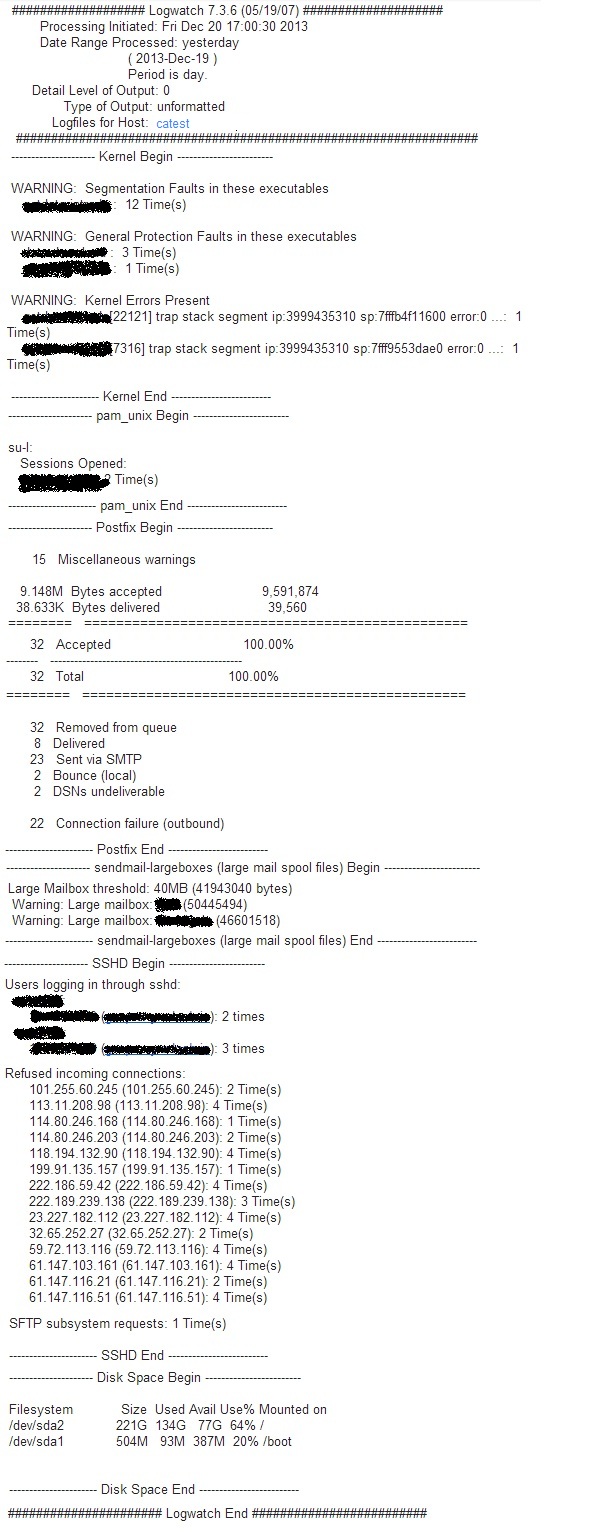
Below is the sample LogWatch output:

To disable LogWatch Email Reports: Follow this guide.


