
Monitoring network connectivity is an important part of server administration. Few tools like ping, traceroute are simple to use and provides valuable information. Today, I’ll show you another powerful diagnostic tool called MTR which combines the functionalities of traceroute and ping programs. MTR stands for My Traceroute - it allows you to investigate the network connection between the host and remote server. It also provides the latency and performance changes over time. Unlike traceroute and ping, MTR doesn’t comes by default. you need to install it:
How to Install MTR:
On Ubuntu/Debian:
sudo apt-get install mtr
On CentOS/Redhat/Fedora:
If you are using Redhat and doesn’t get yum updates, then follow how to Configure yum to use CentOS repo on a Redhat system.
yum install mtr
Loaded plugins: fastestmirror
Loading mirror speeds from cached hostfile
---> Package mtr.x86_64 2:0.75-5.el6 will be installed
--> Finished Dependency Resolution
...
...
Installed:
  mtr.x86_64 2:0.75-5.el6
Complete!
How to use MTR
Once it is successfully installed, you can start using it by typing:
mtr google.com
There are two modes, a Graphical Interface Mode and a text based mode(ncurses). The default mode is Graphical Interface mode.
How to launch MTR in text mode
To specify the text based mode you need to use the below command. The command opens a text based user interface using ncurses, which runs continuously in interactive mode.
mtr --curses google.com
The packets (ICMP) travels through a series of “hops”(Routers or Nodes) and reaches the destination. The output may look very similar to traceroute, but the big advantage over traceroute is that the output gets constantly updated on the current round trip time.
How to generate report using MTR
Below command is issued to generate the report, instead of running in Interactive mode. By default MTR sends 10 packets to the target host and takes a while to print the network statistics. You can change the no. of packets by specifying the option –report-cycles=[number-of-packets]. This mode provides sufficient data in an useful format.
mtr --report google.com
or
mtr --report --report-cycles=12 google.com
How to avoid reverse DNS
During the network trace, MTR finds the hostname of each hope (router/node) by using reverse DNS lookup. If you want to avoid doing a reverse DNS lookup, simply use the –no-dns option:
mtr --no-dns google.com
Understand MTR output
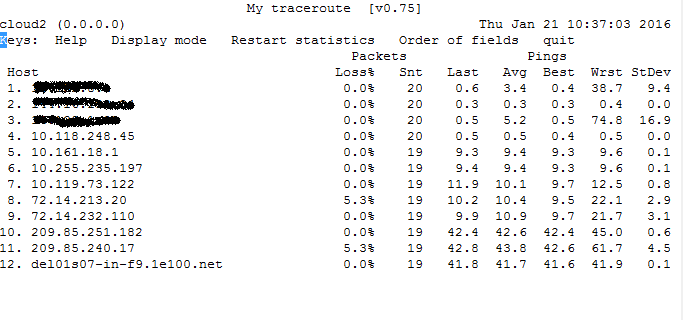
Beyond the path between the host and remote server, MTR provides valuable statistics regarding the durability of that connection in the 7th column as seen in the below output.

Loss % – Shows the percentage of packet loss at each hop.
Snt – Shows the number of packets being sent.
Last – Latency of the last packet sent.
Avg – Average Latency of all packets.
Best – Best (Shortest) round trip time for a packet to this host.
Wrst – Worst (Longest) round trip time for a packet to this host.
StDev – Standard deviation of the latencies to each host.
Last, Avg, Best and Wrst are all measured in milliseconds. The higher the standard deviation, the latency measurements were inconsistent.
Consider an e.g., to understand the above sentence: Of the 10 packets sent to destination, some packets may have low latency of 25ms, whereas few would have a high of 350ms. After averaging the latencies of the 10 packets sent, the average looks normal but may in fact not represent the data very well. So, if the standard deviation is high, take a look at the best and worst columns for latency measurements to make sure the average is a good representation of the actual latency and not the result of too much fluctuation.
Analyzing MTR Reports
Destination host Unreachable
If the destination host is not configured properly or firewall rules have been configured to drop the ICMP packets, you see it like the packets couldn’t reach destination as shown below. But, it does reach the destination.
   8. 10.118.225.253                     0.0%    10   19.0  19.0  18.9  19.2   0.1
  9. ???                                100.0    10    0.0   0.0   0.0   0.0   0.0
How to Verify Packet Loss
The service provider follows a common practice of Limiting the ICMP traffic. This could show as a packet loss, when actually there is no loss. You can verify whether the loss is real or due to rate limiting by checking the Loss % column of the next hop. For e.g., in the below report, the next hop of 100% Loss, shows 0.0%. So it is sure that the Loss is due to the ICMP rate limiting and not the actual loss.
  5. 10.161.18.5                   0.0%     5   14.7  14.5  14.4  14.7   0.1
  6. ???                          100.0     5    0.0   0.0   0.0   0.0   0.0
  7. 10.255.222.34                 0.0%     5   14.1  14.0  13.9  14.2   0.2
Timeout and Return route problem
If any of the hop shows ??? in the output, it can be either due to the problem in return path or alternatively, the routers would have discarded the ICMP packet. Below at hop 6, you can see ???. This might be because of any of the above reasons.
  5. 10.161.18.5                   0.0%     5   14.7  14.5  14.4  14.7   0.1
  6. ???                          100.0     5    0.0   0.0   0.0   0.0   0.0
  7. 10.255.222.34                 0.0%     5   14.1  14.0  13.9  14.2   0.2
Conclusion
MTR is of a great help during troubleshooting an internal network or experiencing network problems. Using MTR reports, you can get the sense as to which routers/host on the way to remote host or a specific domain are causing the problem.