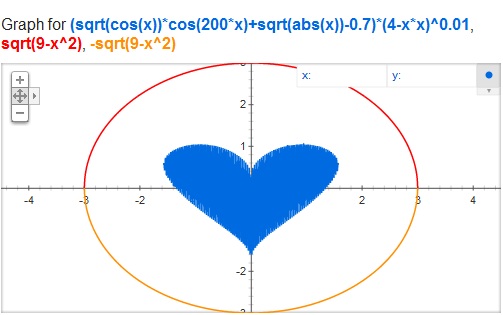
Google always finds a way to attract people. And now its time for Google to show some love to maths lovers. Google has introduced a new search feature that will allow you to create graphs for complex mathematical functions just by putting them into the search box. According to the Google’s official post, the introduction of graphing functionality on Google will allow you to plot mathematical functions right on the search result page. All you need to do is, just type in a function in the search box and Google will plot an interactive graph on the top of the search results page.
Lets try out an sample function, copy the following function and paste in the Google search box.
(sqrt(cos(x))*cos(200x)+sqrt(abs(x))-0.7)*(4-x*x)^0.01, sqrt(9-x^2), -sqrt(9-x^2) from -4.5 to 4.5
This is what Google does for you, it plots an interactive graph for the above function. You will love it!
Some of the features are,
- Provides zoom in and out
- Pan across the plane to explore the function in more detail.
- Draw multiple functions with a comma delimiter.
- Functions supported are trigonometric, exponential, logarithmic and their compositions
- Well this feature works on all modern web browsers.


