There are plenty of factors that can affect your website’s performance. For instance, the size of the web page, number of HTTP requests, network latency, server response time etc…As a developer, you might keep adding new features, designs etc… and sometimes you might forget to remove old styles declared on your stylesheet. Such unused CSS rules will add to your page size and will ultimately result in high load time. But identifying the unused CSS rules is not that easy. Thankfully, Google Chrome has a feature called “Audit” (as a part of Chrome Developer tools) that helps you to identify and remove unused CSS rules.
Chrome Audit tool reports various factors that affect website’s performance; For instance, Web Page Performance, Network performance related issues such as Minimize cookie size, Leverage browser caching, Leverage proxy caching etc…
How to access Chrome Developer tools?
Option 1 : You can access Chrome’s Developer Tools by clicking 
> Tools > Developer tools.
Option 2: Right click on a webpage and select "Inspect element"
Option 3:
- Use
Ctrl+Shift+I(orCmd+Opt+Ion Mac) to open the DevTools. - Use
Ctrl+Shift+J(orCmd+Opt+Jon Mac) to open the DevTools and bring focus to the Console. - Use
Ctrl+Shift+C(orCmd+Shift+Con Mac) to open the DevTools in Inspect Element mode, or toggle Inspect Element mode if the DevTools are already open.
Audit your website
On older versions of Chrome:
Click on "Audits" tab to reveal the Chrome Audit window.
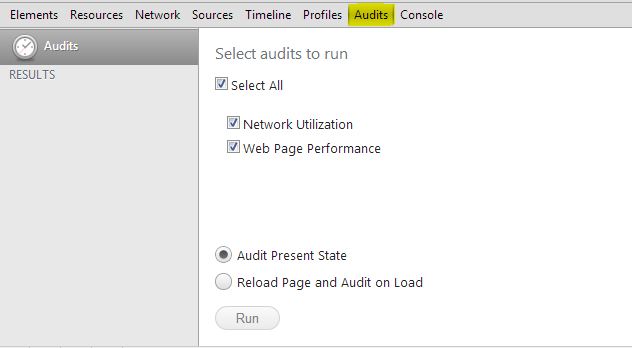
You can choose to enable or disable the kind of Audits you like to perform. Similarly, you can choose to Audit the webpage at its present state or reload the page and audit on load. Once done, click ‘Run' button.
Once the Audit is completed, the tool will display the list of identified problems as below. It will also save the results and it can be access under Results tab.
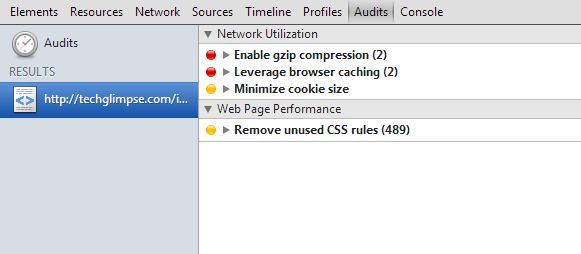
Click on the arrow to see the identified issues and fix it.
On Chrome version 61.0.3163.100
Step 1: Right clickanywhere on the page and select "Inspect"
Step 2: Click on Audits tab
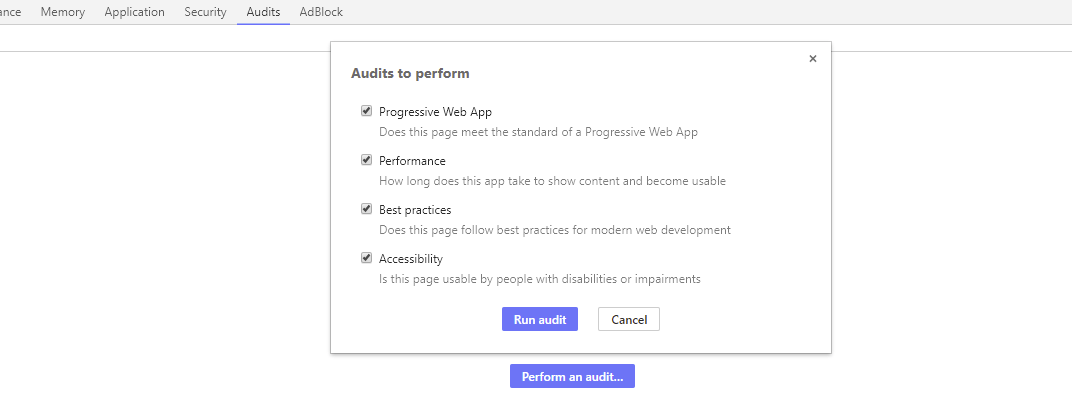
Step 3: Click "Perform an audit..." button.
Step 4: Developer Tools will list of categories to be audited. Leave all categories checked and click "Run audit" button.
Step 5: You may have to wait for few seconds until Chrome completes auditing. This step involves in loading your webpage few times, before developer tools fetches traces.
Step 6: Once the audit is completed, a report will be generated as shown in the below screenshot.
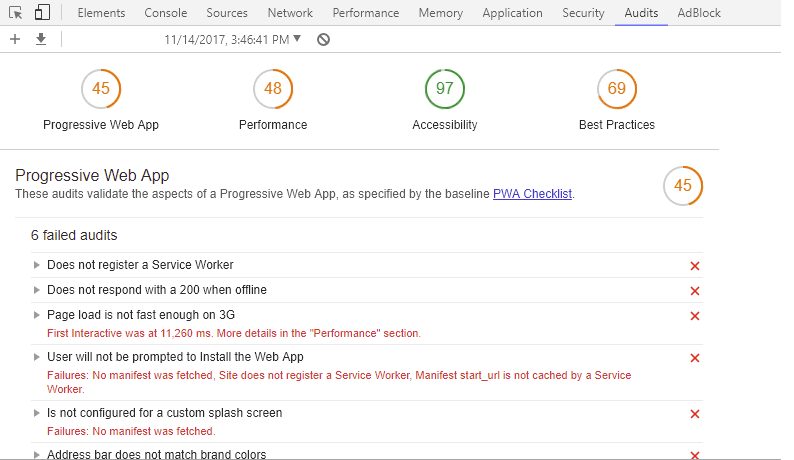
Step 7: Click on each category to audit results and recommendations.
How to fix Audit issues reported by Chrome Developer Tools?
Well, I may not be able to discuss all issues. But below are few I had to fix for my clients.
Best Practices
Click on "Best Practices" category to view recommendations for modernizing your web applications. This section will include results of passed & failed audits.
Use HTTPs
You should start migrating your website to HTTPs, as Google uses this signal for ranking search results. You can buy highest standard of SSL certificates from Comodo or get free SSL certificate from LetsEncrypt. Remember, if you are migrating your WordPress site from HTTP to HTTPs, then you may have to fix mixed content errors.
Does not open external anchors using rel=”noopener”
If your webpage contains external anchors using target="_blank" and without rel="noopener" attribute, then you would probably see Does not open external anchors using rel=”noopener” alert under Best Practices section. The reason is, target="_blank" will open an external webpage in a new window or tab under the same process as the linking page, thus providing window.opener object. It means, if an external window loading an expensive JavaScript, then it can affect the performance of the linking page as well. Here’s a tutorial that explains why you should use rel=”noopener” for external anchors and how to fix this audit issue.
Progressive Web App
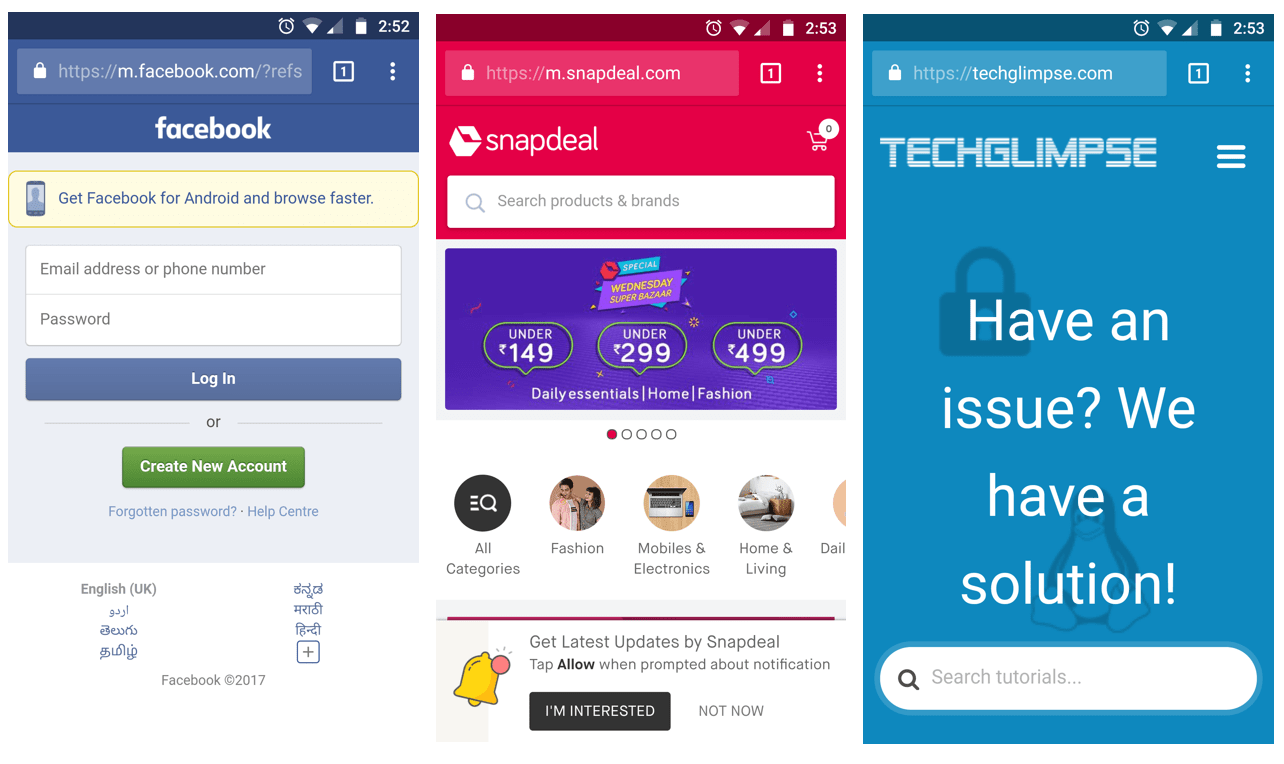
Address Bar Matches Brand colors
The one way to improve user experience visually is by matching the browser’s address bar color with the website theme’s color. Doing so will also bring native-app like look and feel of your website on mobile browsers (something like the one shown below). Do you wanna implement it? Here’s a tutorial.